
甲基化测序 · 表观基因组学服务 · 成果解读专刊
迄今国内规模最大的痛风 DNA 甲基化研究
发表于风湿病学顶刊 Ann Rheum Dis(2026)· IF 24 · 中科院一区
核心速览
| 发表期刊 | 甲基化测序队列 | 诊断模型最高 AUC |
|---|---|---|
| IF 24 · 中科院一区 Ann Rheum Dis(风湿病学顶刊) | 369 例 痛风 124 / 高尿酸 121 / 对照 124 | 0.96 痛风 vs 正常对照(仅甲基化) |
近日,痛风表观基因组学领域迎来一项里程碑研究——正式发表于风湿病学顶级期刊《Annals of the Rheumatic Diseases》(Ann Rheum Dis,影响因子 24,中科院一区)。该研究由青岛大学附属医院、复旦大学附属华山医院、华南理工大学与牛津大学肯尼迪风湿病研究所等团队联合完成,我司承担了全流程 DNA 甲基化测序与表观基因组学分析服务。
研究以 369 例受试者构建了目前公开报道中规模最大的痛风 / 高尿酸血症 DNA 甲基化队列,并首次建立并验证了性能突出的甲基化诊断模型:痛风 vs 正常对照 AUC 高达 0.96,临床最难区分的痛风 vs 无症状高尿酸血症则从 0.67 提升至 0.87。这不仅是一次方法学突破,更意味着:”尿酸高”和”得了痛风”之间那道未被解开的鸿沟,第一次被甲基化层写下了分子注解。
一、研究背景:为什么”尿酸高”不等于”痛风”
痛风源于长期高尿酸血症下尿酸盐晶体沉积,但血尿酸升高只是必要条件——绝大多数高尿酸人群终身不会发病。既往 GWAS 找到的易感变异多位于非编码区,只能解释很小一部分风险。DNA 甲基化正是连接遗传背景与环境暴露的关键表观开关;而此前研究仅停留在个别候选基因,从未有过”痛风 vs 无症状高尿酸血症”的全基因组比较。本研究填补了这一空白。
二、研究设计:两阶段队列,数据质量”教科书级”
研究采用两阶段病例对照:发现阶段(n=83)用全基因组靶向重亚硫酸盐测序(TBS),验证阶段(n=286)用靶向扩增子甲基化测序独立验证。数据指标亮眼:单样本平均 11.7 Gb 数据量、94.8% 比对率、98.2% 目标覆盖、467 万 CpG 位点、54× 深度、转化率 >99%。三大两两比较分别锁定 289 / 254 / 291 个差异甲基化区域(DMR)。
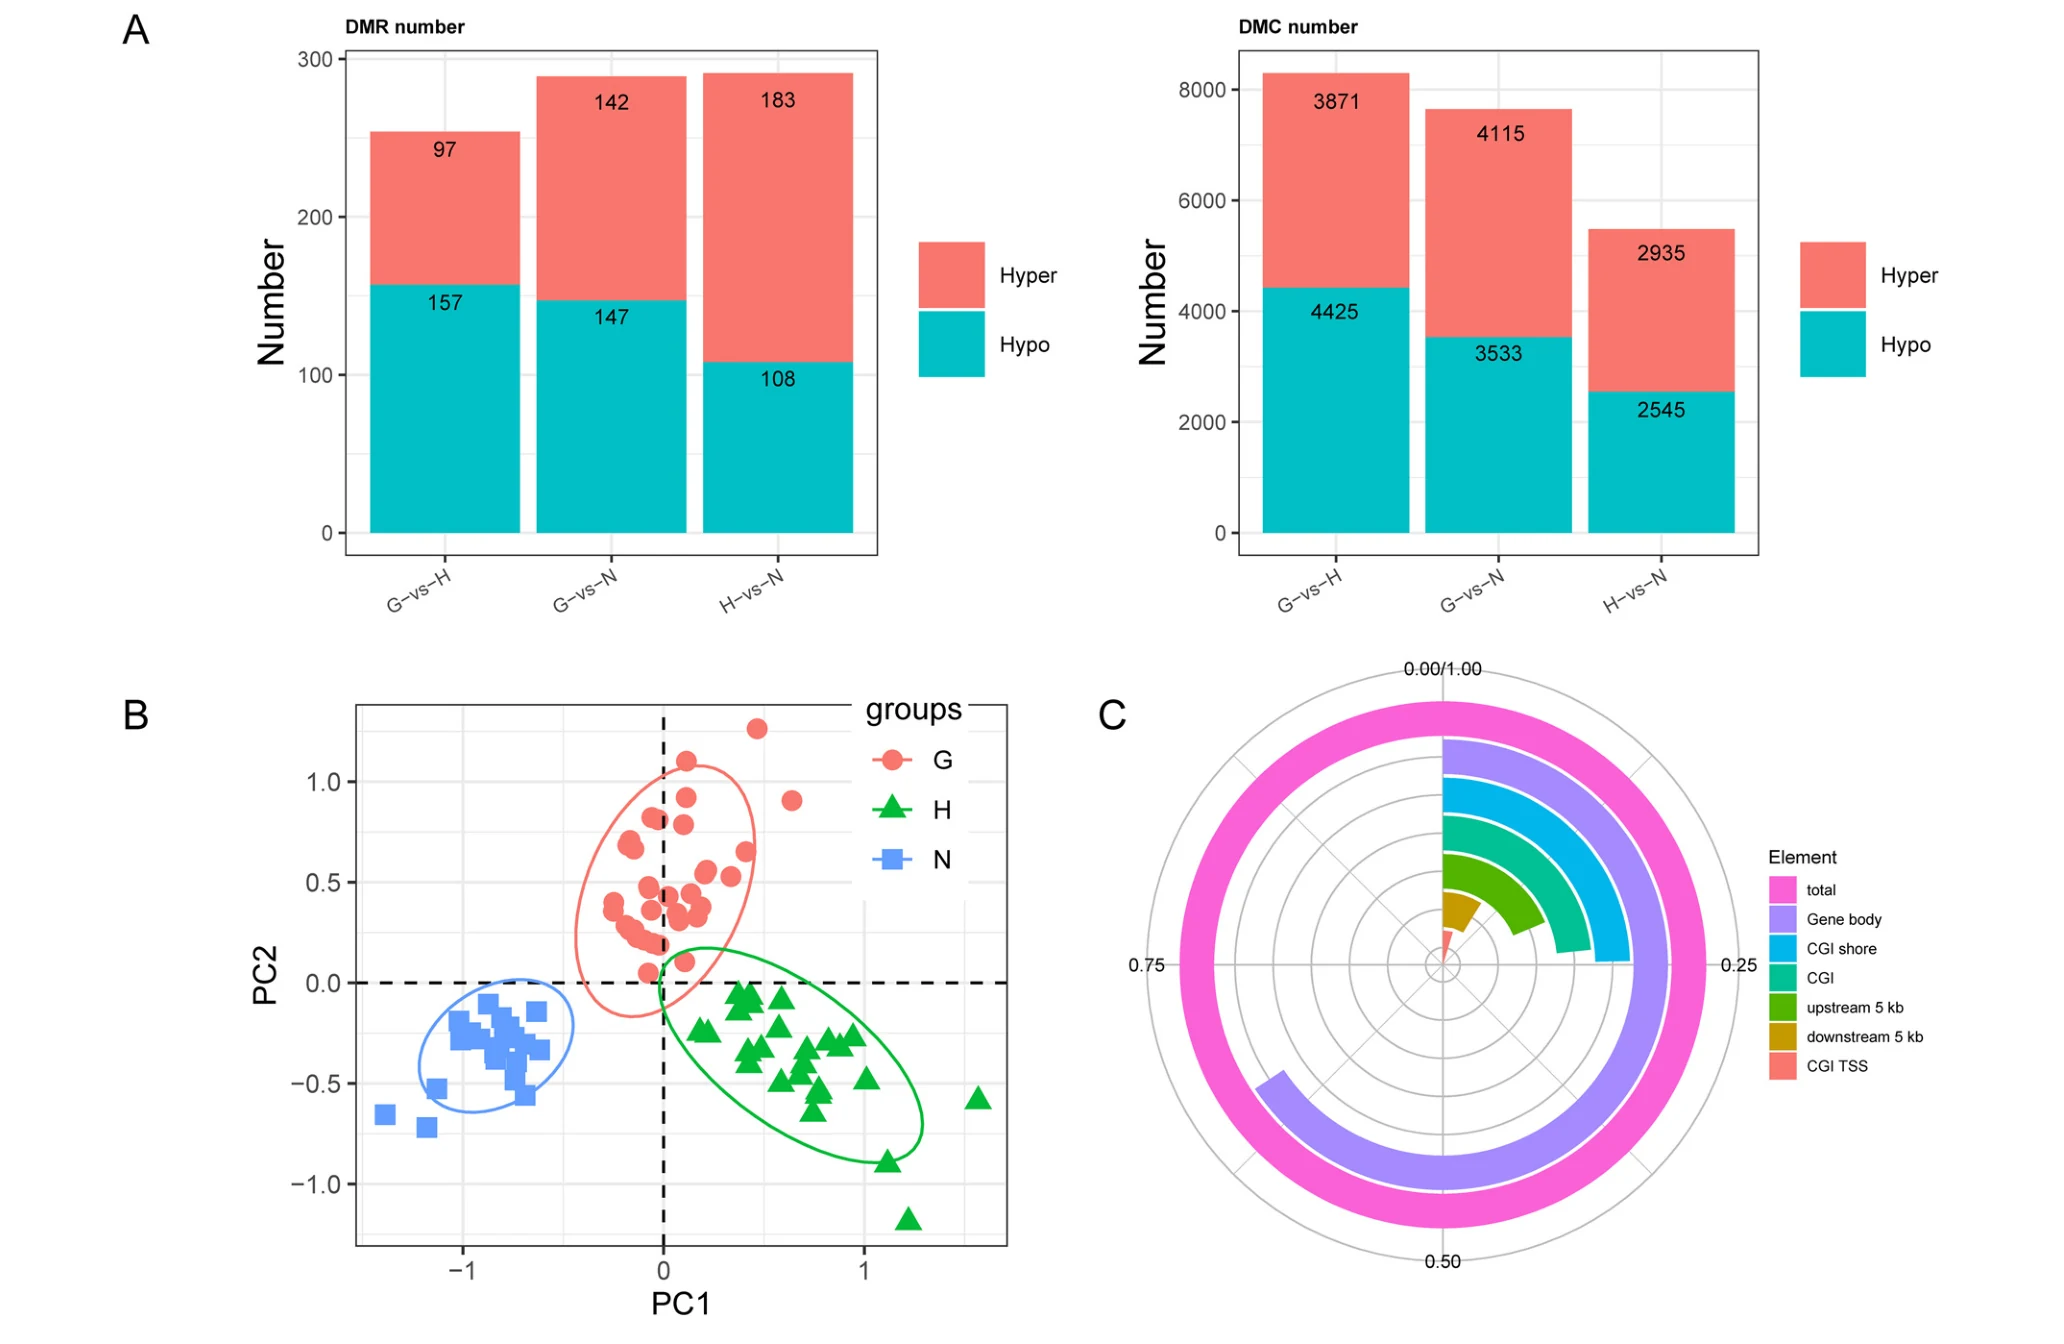
一句话解读:疾病相关的甲基化改变是局部、有序、分阶段的,而非全基因组随机噪声——这正是甲基化能当”分子分层标尺”的底气。
三、发现一:甲基化与遗传风险”殊途同归”
将 541 个差异甲基化基因与 2703 个痛风 / 尿酸 GWAS 位点交叉,得到 84 个同时携带遗传变异与甲基化改变的基因。通路富集高度集中于抗原加工与呈递,并延伸至免疫介导疾病与代谢轴;网络中 HLA-DRB1、TAP2、GNAS 连接度最高,把免疫激活与代谢紊乱两条主线索串在一起。
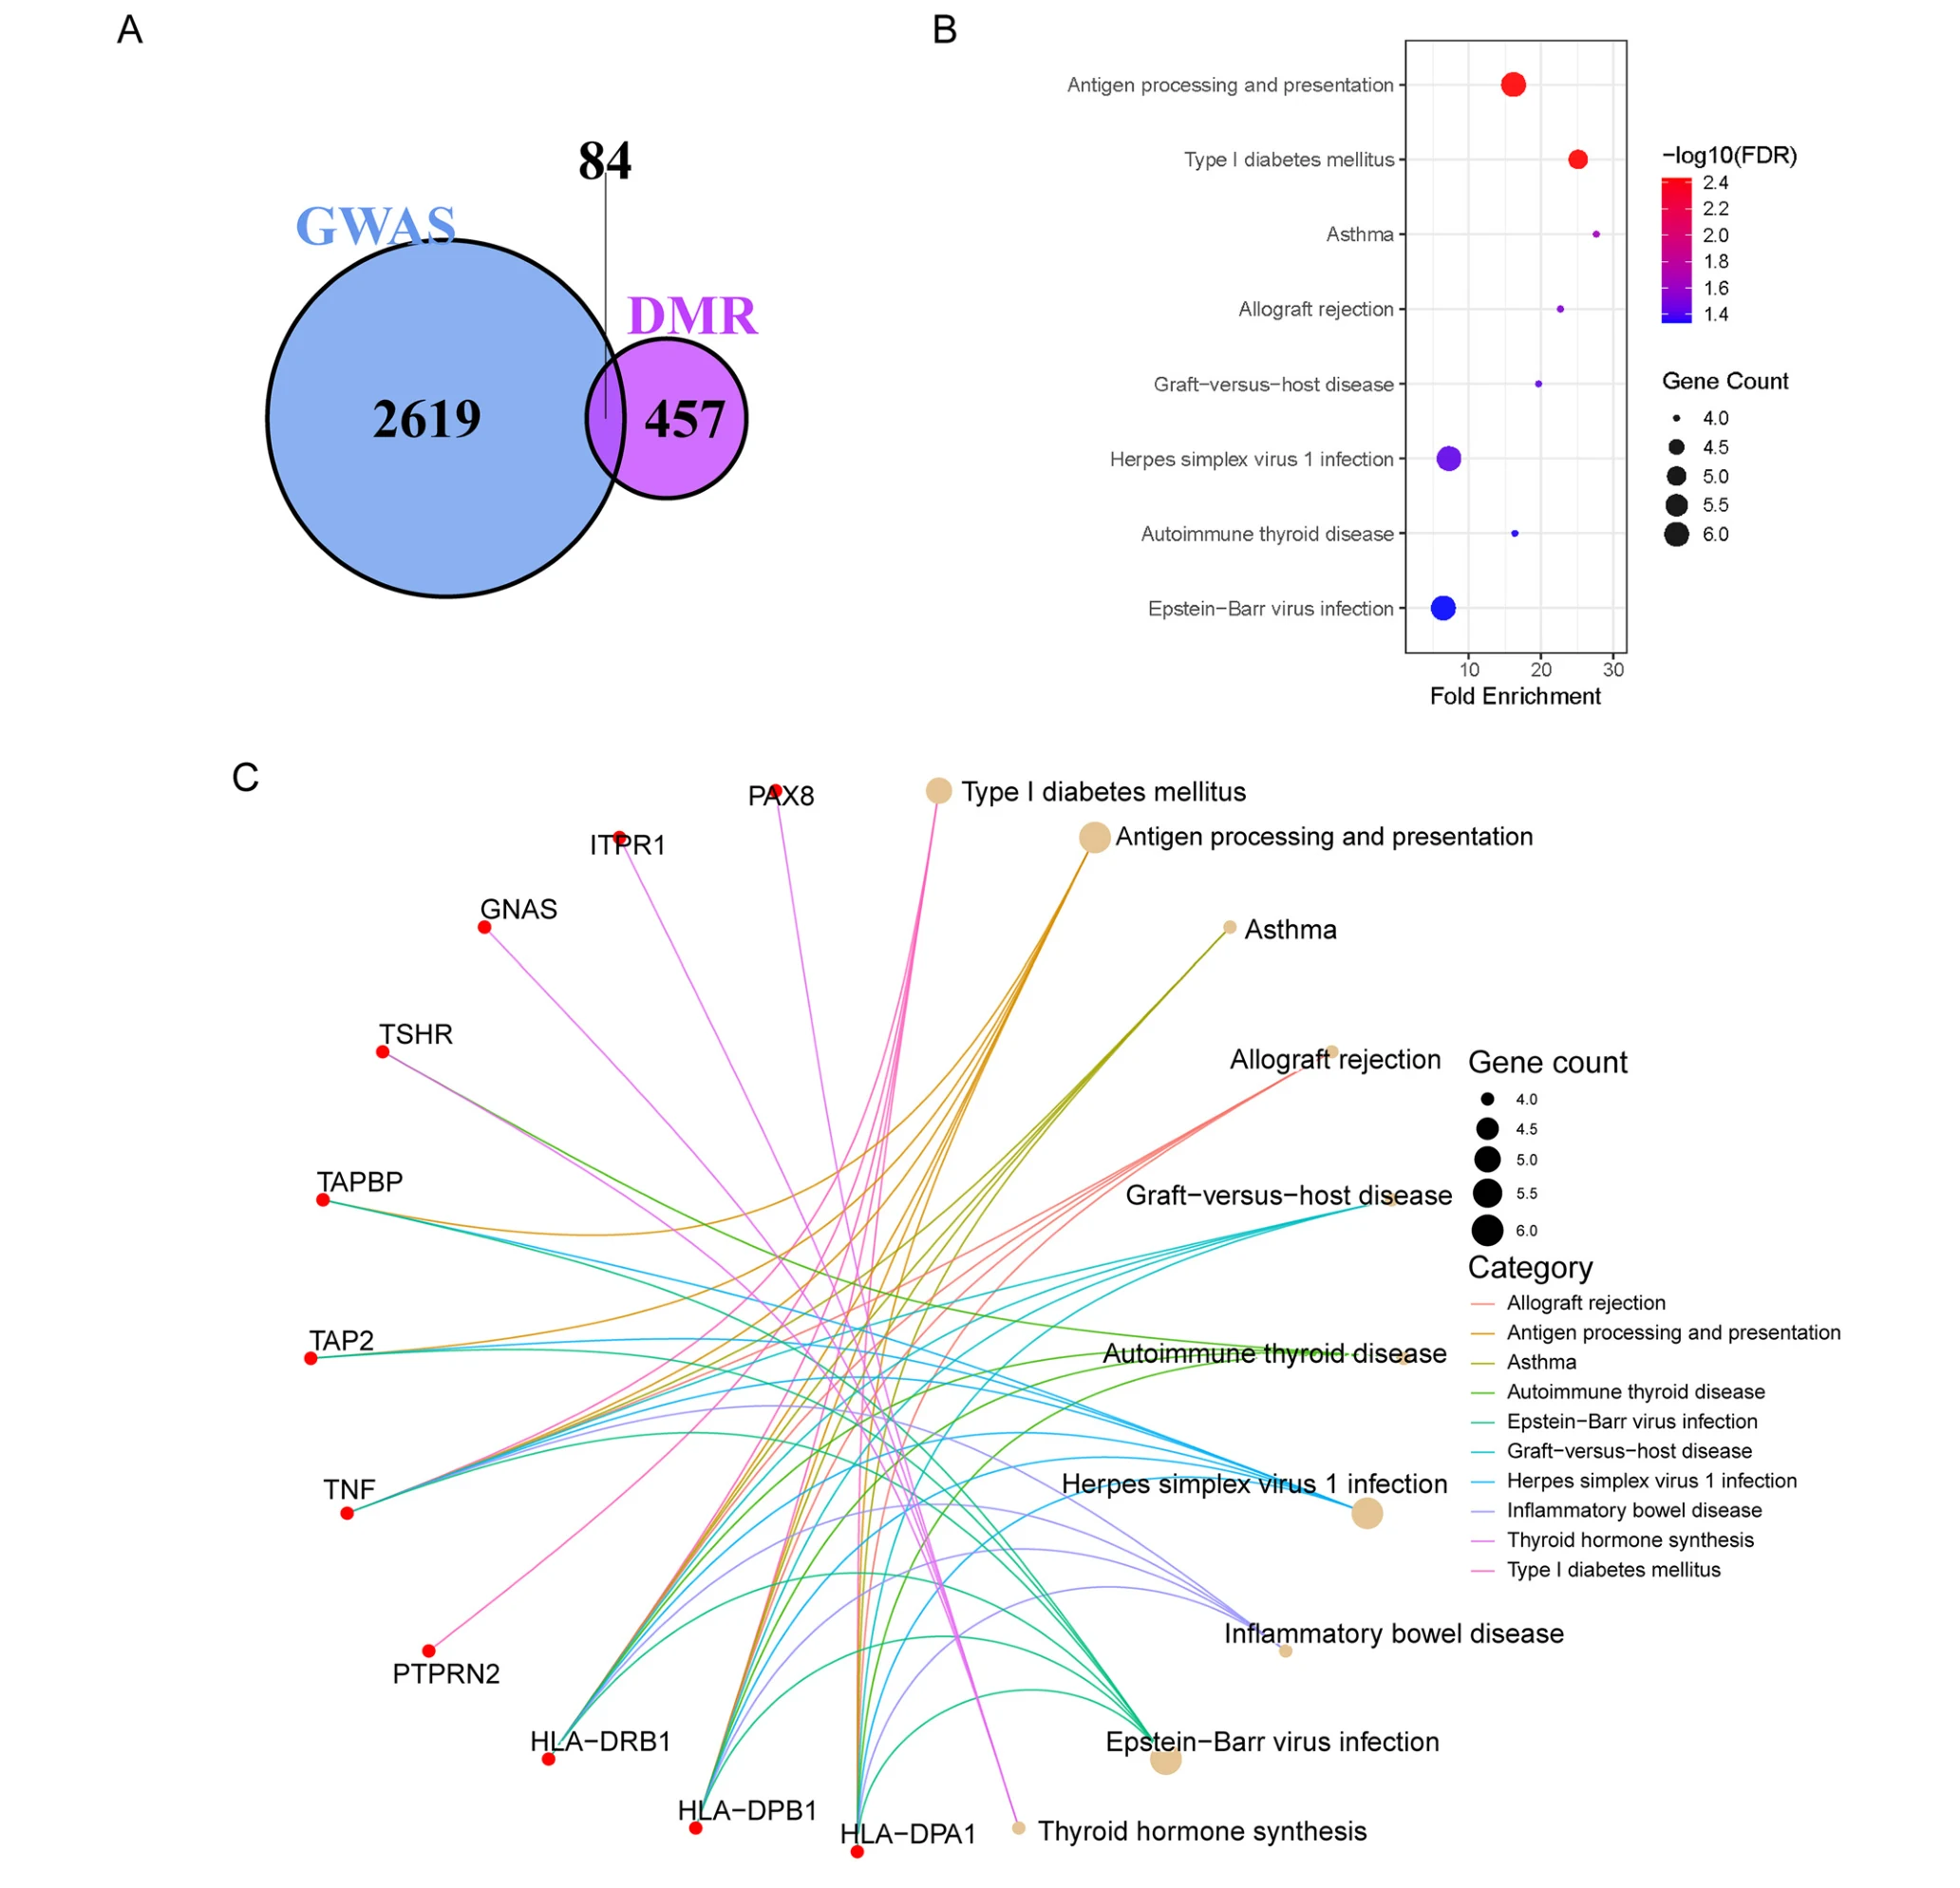
一句话解读:遗传风险不是”一键发病”,而是要经过甲基化这层调光开关的放大或抑制——甲基化正是决定遗传易感性是否被翻译成疾病的关键调控层。
四、发现二:转录因子调控网络浮出水面
研究在 1172 个转录因子的 360 万个结合位点中筛出 16 个显著富集因子,其中 MLXIPL、ZSCAN5A、ZBTB45、ZNF571 最强。网络显示 ZNF571 是痛风特异性高甲基化的候选上游因子,预测靶点包括炎症关键介质 IL27 与 SAA2,为高尿酸向痛风转变中的免疫启动机制提供了新假设。
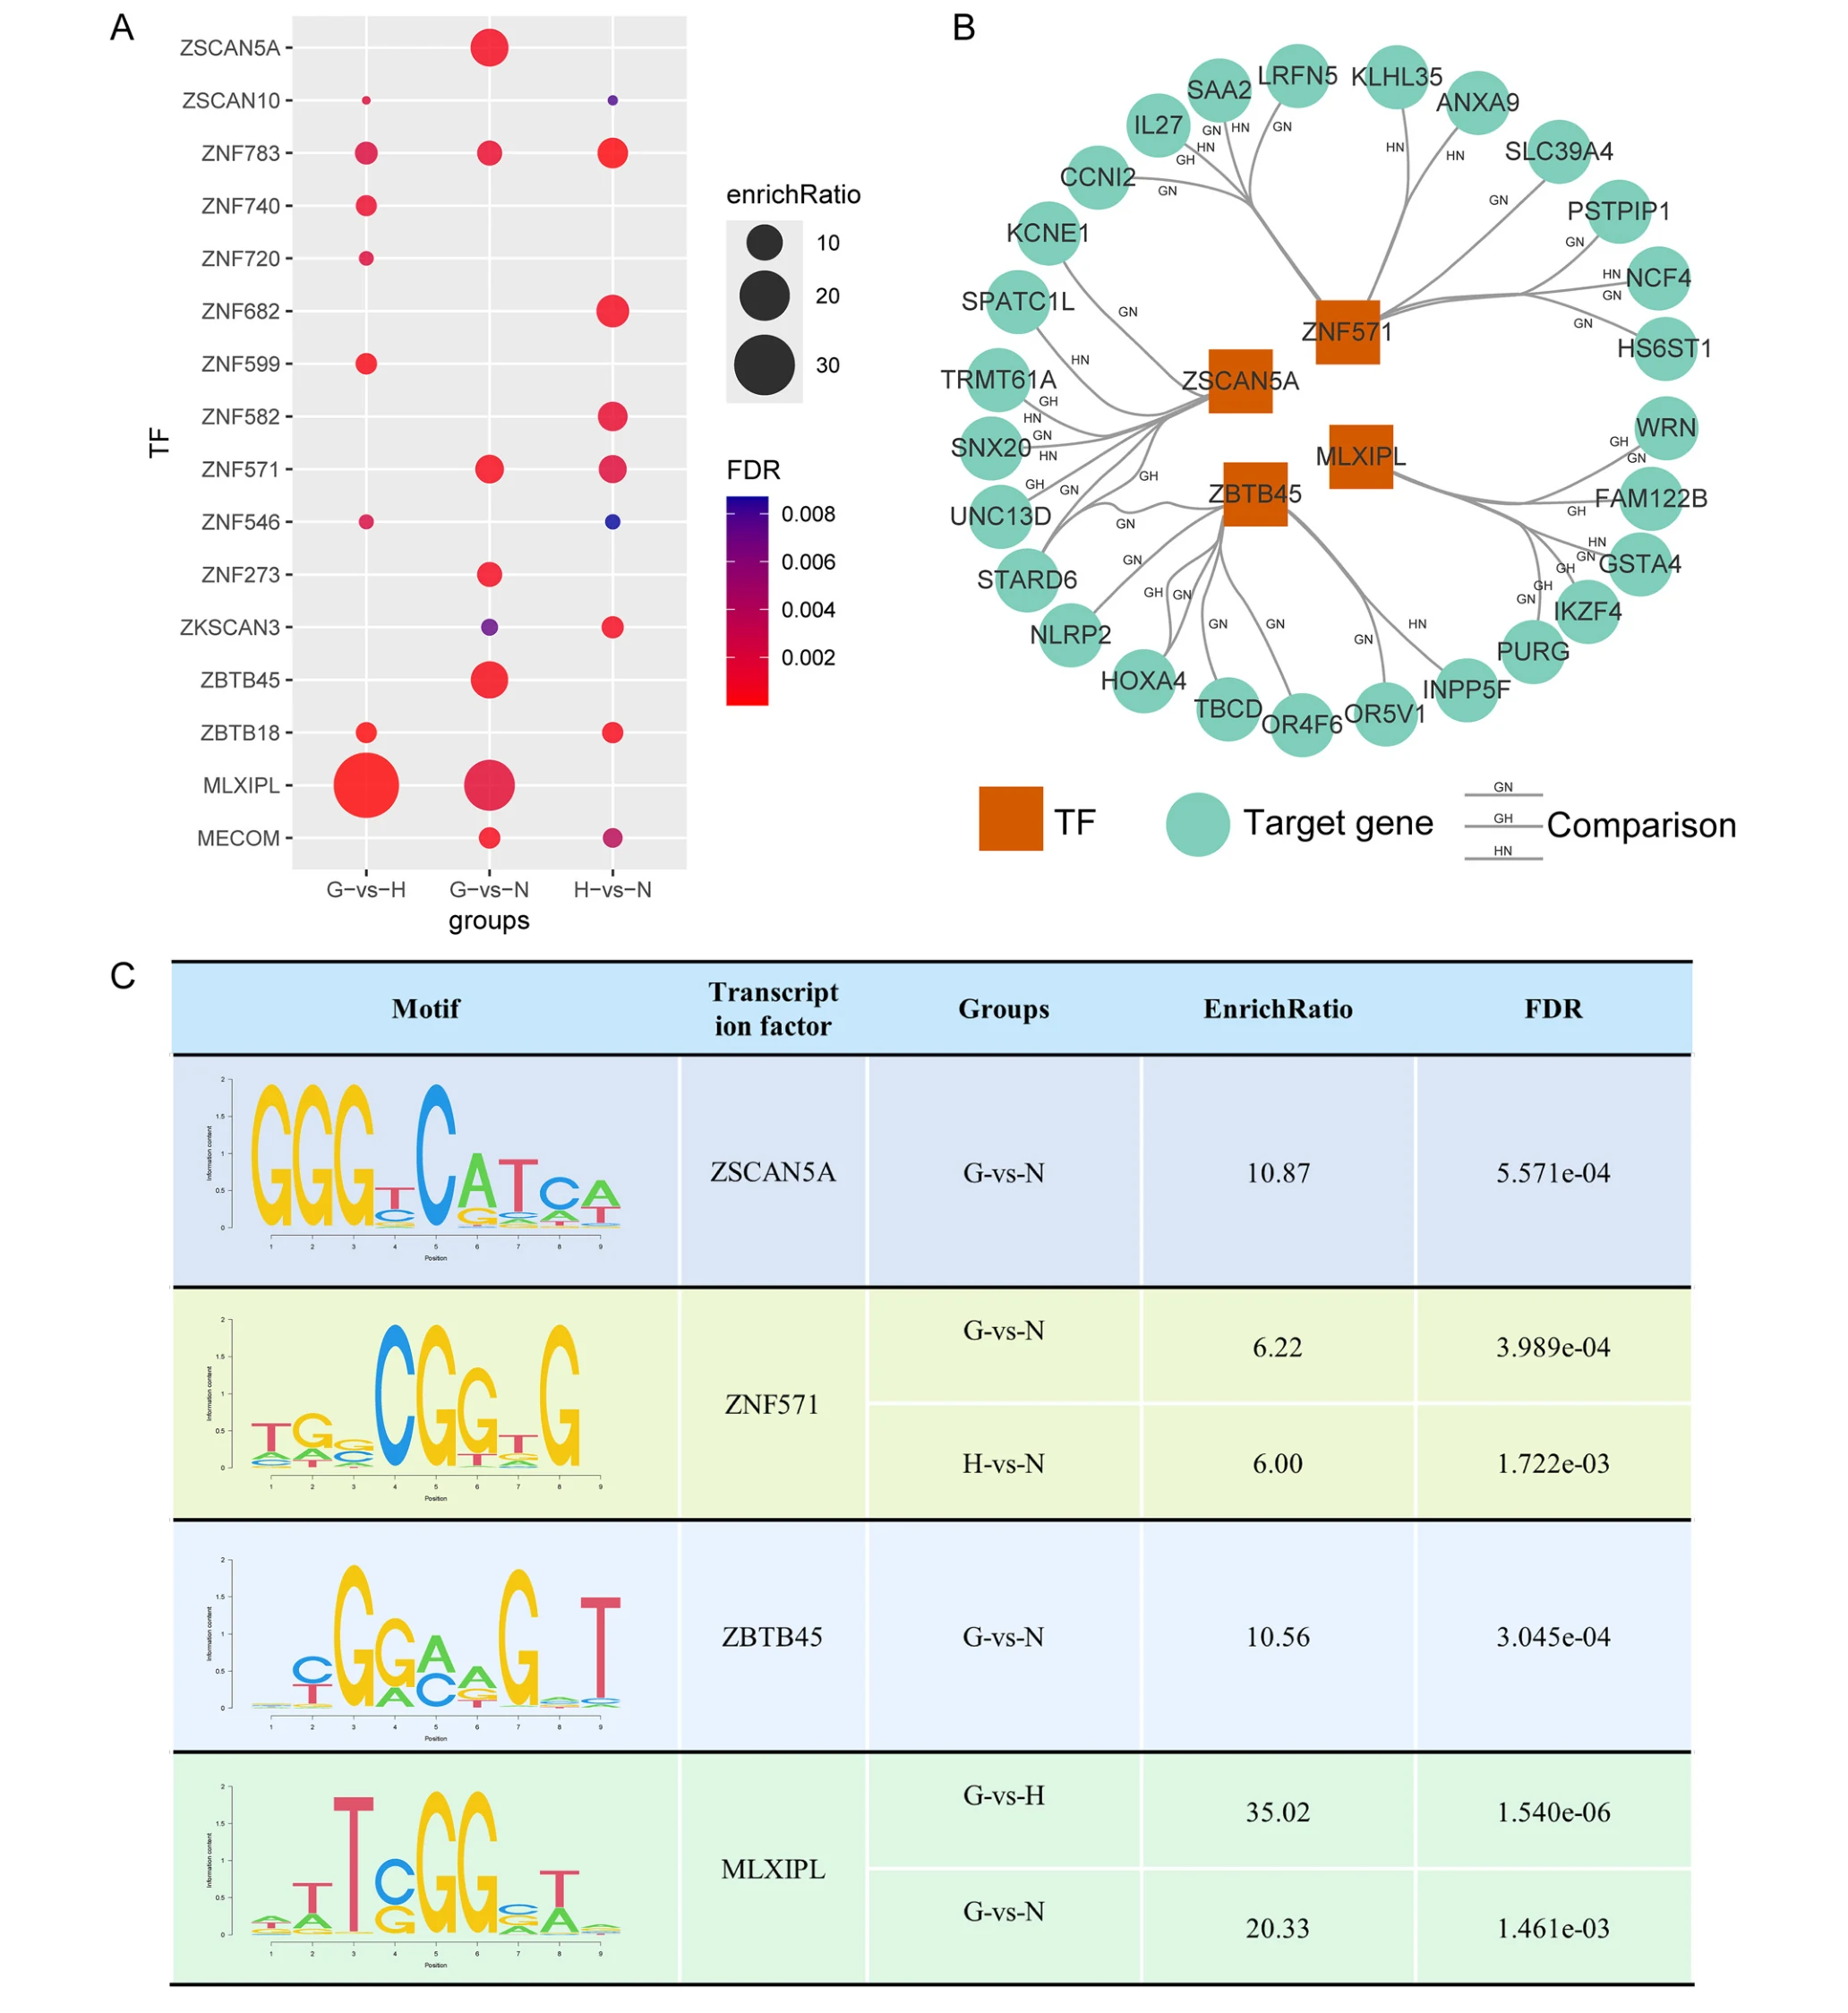
一句话解读:这提示痛风可能存在”训练免疫”式的固有免疫预激——在发病之前,甲基化就已经把炎症的引信装好了。
五、发现三:甲基化诊断模型全面”破圈”
验证阶段确认 113 个差异甲基化位点,经 BMI、血糖、肌酐校正后保留 90 个,用 LASSO 逻辑回归构建”仅甲基化 / 仅临床 / 联合”三类模型,独立测试集成绩如下:
| 对比场景 | 仅临床 AUC | 仅甲基化 AUC | 联合模型 AUC |
|---|---|---|---|
| 痛风 vs 非痛风 | 0.78 | 0.91 | 0.83 |
| 痛风 vs 无症状高尿酸 | 0.67 | 0.80 | 0.87 |
| 尿酸代谢异常 vs 正常 | 0.88 | 0.82 | 0.94 |
| 痛风 vs 正常对照 | 0.87 | 0.96 | 0.92 |
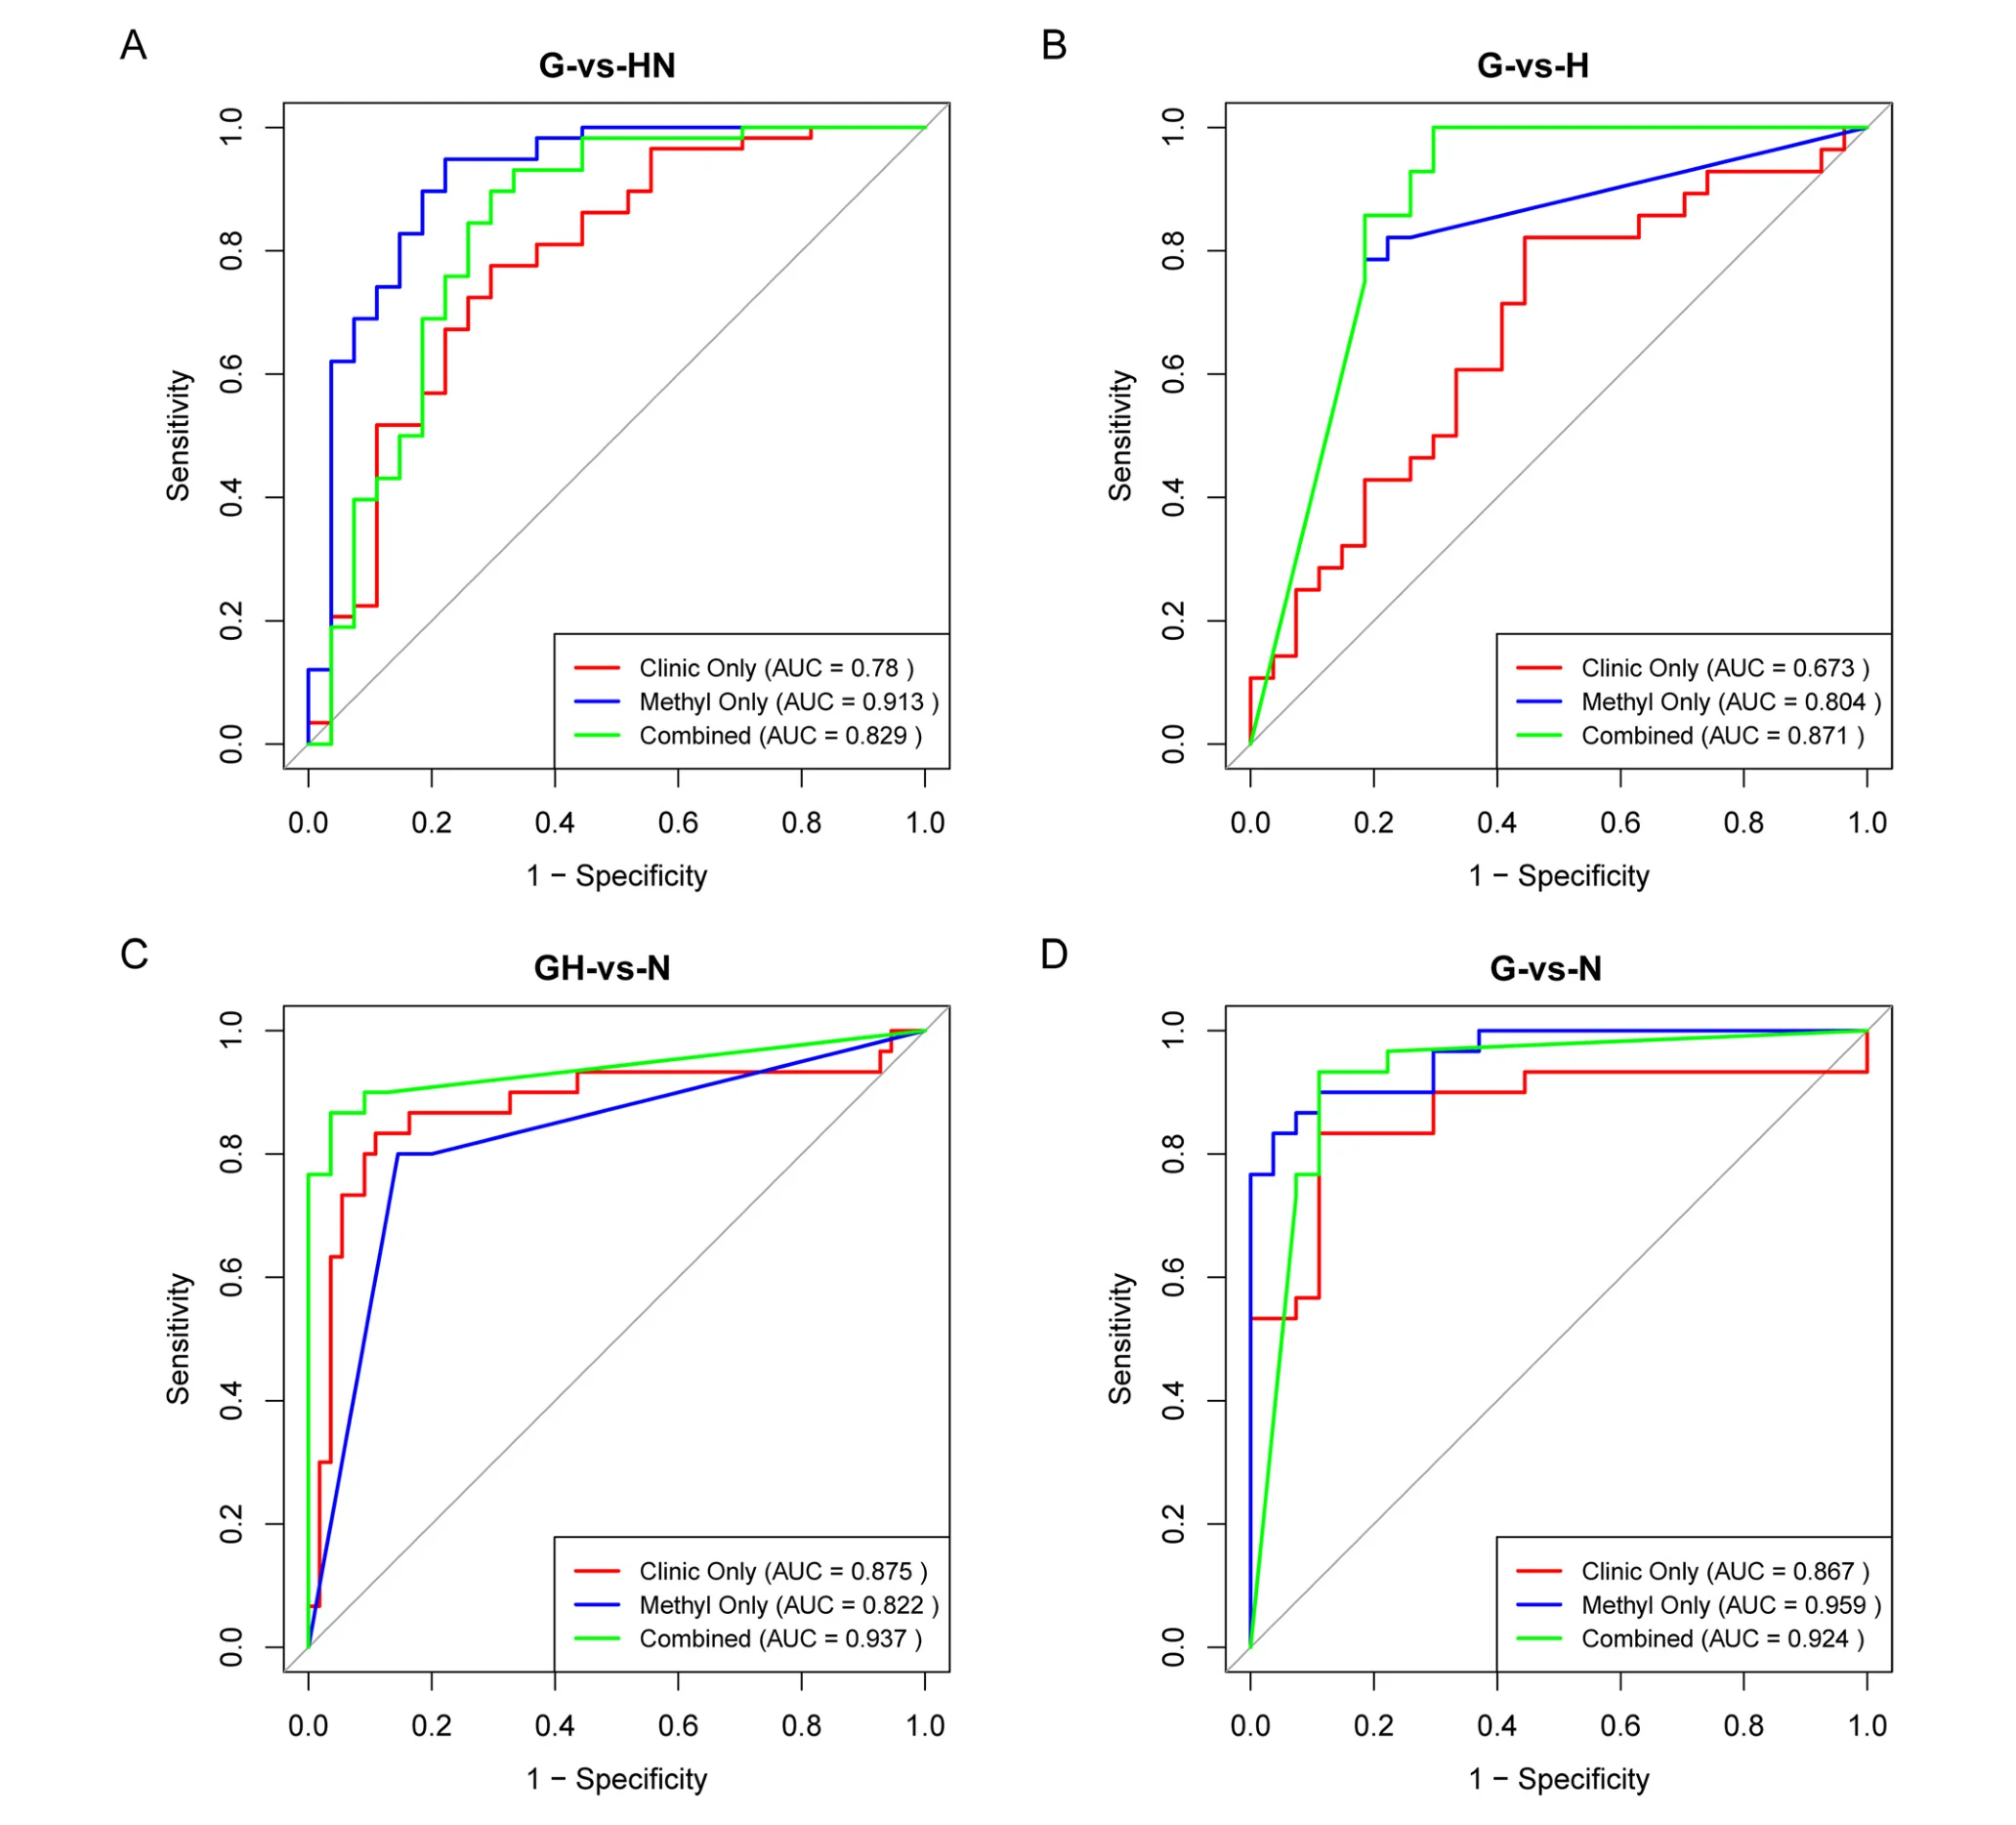
三点值得关注:痛风 vs 正常对照仅甲基化模型 AUC 达 0.96,为全研究最高;痛风 vs 非痛风,甲基化显著优于临床指标(0.91 vs 0.78,P=0.032);而临床几乎无解的痛风 vs 无症状高尿酸,联合模型把 AUC 从 0.67 拉到 0.87(P=0.018),证明甲基化携带了独立于血尿酸的诊断信息。
六、行业意义:从”看尿酸”到”看表观基因组”
这项研究把痛风分子分层的边界,从单一血尿酸推进到表观基因组层面:诊断端,甲基化标志物有望补足血尿酸短板,尤其在棘手分型中提供决策依据;研发端,药物重定位分析指向心血管、呼吸与泌尿系统靶点,为共病机制与新药方向提供线索;服务端,本项目验证了大规模、高深度甲基化测序在复杂慢病队列中的稳定交付能力。
审慎说明:本研究队列为男性、年龄区间较窄且均为初诊未治疗人群,甲基化标志物进入临床前仍需前瞻性验证。
结语
从 369 例样本到 AUC 0.96,从 84 个遗传-表观交汇基因到 ZNF571 调控网络,这篇 IF 24 一区论文不只是一次”发表”,更是痛风表观基因组学从 0 到 1 的分层范式确立。作为本研究的甲基化测序与表观分析服务方,我们将继续以高深度、高覆盖、可重复的技术体系,与更多临床与科研团队一起,把表观遗传学发现推向真正的临床价值。
附录:技术服务咨询
甲基化测序 / 表观基因组学测序服务(靶向重亚硫酸盐测序 TBS、靶向扩增子甲基化测序、全基因组甲基化图谱与诊断模型构建),欢迎联系我们。
客户服务部:19925189446 客服邮箱:service@afire-gene.com
Methylation Sequencing · Epigenomics Services · Research Highlight
The Largest Gout DNA Methylation Study in China to Date
Published in Annals of the Rheumatic Diseases (2026) · IF 24 · CAS Zone 1
Executive summary
| Journal | Methylation cohort | Highest diagnostic AUC |
|---|---|---|
| IF 24 · CAS Zone 1 Ann Rheum Dis (leading rheumatology journal) | 369 participants gout 124 / asymptomatic hyperuricemia 121 / healthy controls 124 | 0.96 gout vs healthy controls (methylation model alone) |
A landmark study in gout epigenomics has been published in Annals of the Rheumatic Diseases (Ann Rheum Dis; impact factor 24; CAS Zone 1), a leading journal in rheumatology. The work was conducted jointly by teams from the Affiliated Hospital of Qingdao University, Huashan Hospital of Fudan University, South China University of Technology and the Kennedy Institute of Rheumatology, University of Oxford. AfireGene provided the full workflow of DNA methylation sequencing and epigenomic analysis.
Based on 369 participants, the study established the largest publicly reported DNA methylation cohort of gout and hyperuricemia to date, and for the first time constructed and validated a high-performance methylation-based diagnostic model. The AUC reached 0.96 for gout versus healthy controls, and increased from 0.67 to 0.87 for the most difficult clinical discrimination — gout versus asymptomatic hyperuricemia (AHU). This is more than a methodological advance: the gap between “elevated serum uric acid (SUA)” and “established gout” has, for the first time, received a molecular annotation at the methylation level.
1. Background: why elevated SUA does not equal gout
Gout results from monosodium urate (MSU) crystal deposition during long-standing hyperuricemia. However, elevated SUA is only a necessary condition — the great majority of individuals with hyperuricemia never develop the disease. Susceptibility variants identified by previous genome-wide association studies (GWAS) lie mostly in non-coding regions and explain only a small fraction of the genetic risk. DNA methylation is a key epigenetic switch linking genetic background to environmental exposure, yet earlier studies were restricted to a few candidate genes, and a genome-wide comparison of gout versus AHU had never been performed. This study fills that gap.
2. Study design: a two-stage cohort with textbook-quality data
A two-stage case–control design was used. The discovery stage (n=83) applied genome-wide targeted bisulfite sequencing (TBS), and the validation stage (n=286) independently verified the findings using targeted amplicon methylation sequencing. The data metrics were strong: a mean of 11.7 Gb per sample, an alignment rate of 94.8%, on-target coverage of 98.2%, 4.67 million CpG sites, a mean depth of 54× and a bisulfite conversion rate above 99%. The three pairwise comparisons identified 289, 254 and 291 differentially methylated regions (DMRs), respectively.
In brief: disease-associated methylation changes are focal, ordered and stage-dependent rather than genome-wide random noise — precisely why methylation can serve as a molecular stratification ruler.
3. Finding 1: methylation and genetic risk converge on the same pathways
Cross-referencing 541 differentially methylated genes with 2,703 gout and uric acid GWAS loci identified 84 genes carrying both genetic variants and methylation changes. Pathway enrichment was concentrated in antigen processing and presentation and extended to immune-mediated diseases and metabolic axes. HLA-DRB1, TAP2 and GNAS showed the highest connectivity in the network, linking immune activation with metabolic dysregulation.
In brief: genetic risk is not a single-step trigger; it passes through the methylation dimmer, which amplifies or suppresses it. Methylation is the regulatory layer that determines whether genetic susceptibility is translated into disease.
4. Finding 2: a transcription factor regulatory network emerges
Among 3.6 million binding sites of 1,172 transcription factors (TFs), 16 significantly enriched TFs were identified, with MLXIPL, ZSCAN5A, ZBTB45 and ZNF571 being the strongest. The network suggests ZNF571 as a candidate upstream regulator of gout-specific hypermethylation, with predicted targets including the key inflammatory mediators IL-27 and SAA2, providing a new hypothesis for immune priming during the transition from hyperuricemia to gout.
In brief: this points to a trained-immunity-like innate immune priming in gout — methylation has already set the inflammatory fuse before clinical onset.
5. Finding 3: the methylation-based diagnostic model performs across scenarios
The validation stage confirmed 113 differentially methylated sites, of which 90 were retained after adjustment for body mass index (BMI), blood glucose and creatinine. LASSO logistic regression was used to build methylation-only, clinical-only and combined models, with the following results on the independent test set:
| Comparison | Clinical model AUC | Methylation-only AUC | Combined model AUC |
|---|---|---|---|
| Gout vs non-gout | 0.78 | 0.91 | 0.83 |
| Gout vs AHU | 0.67 | 0.80 | 0.87 |
| Abnormal urate metabolism vs normal | 0.88 | 0.82 | 0.94 |
| Gout vs healthy controls | 0.87 | 0.96 | 0.92 |
Three findings deserve attention. First, the methylation-only model reached an AUC of 0.96 for gout versus healthy controls, the highest in the study. Second, for gout versus non-gout, methylation significantly outperformed conventional clinical indicators (0.91 vs 0.78; P=0.032). Third, for gout versus AHU — a discrimination that clinical variables alone can hardly resolve — the combined model raised the AUC from 0.67 to 0.87 (P=0.018), demonstrating that methylation carries diagnostic information independent of SUA.
6. Significance: from measuring uric acid to reading the epigenome
The study extends the boundary of molecular stratification in gout from a single SUA measurement to the epigenome. On the diagnostic side, methylation markers may compensate for the limitations of SUA and support decision-making in difficult subtypes. On the research and development side, drug repositioning analysis points to cardiovascular, respiratory and urological targets, offering clues for comorbidity mechanisms and new therapeutic directions. On the service side, the project demonstrates reliable delivery of large-scale, high-depth methylation sequencing in complex chronic-disease cohorts.
Caveat: the cohort consisted of men only, with a narrow age range, all newly diagnosed and untreated. Prospective validation is still required before methylation markers can enter clinical practice.
Conclusion
From 369 samples to an AUC of 0.96, from 84 genes with combined genetic and epigenetic evidence to the ZNF571 regulatory network, this IF 24, CAS Zone 1 paper is more than a publication — it establishes a stratification paradigm for gout epigenomics. As the provider of methylation sequencing and epigenomic analysis for this study, AfireGene will continue to work with clinical and research teams, applying deep, comprehensive and reproducible technical systems to translate epigenetic discoveries into clinical value.
Appendix: Technical service enquiries
Methylation sequencing and epigenomics services — targeted bisulfite sequencing (TBS), targeted amplicon methylation sequencing, genome-wide methylation profiling and diagnostic model construction. We welcome your enquiries.
Customer Service: +86 199 2518 9446 Email: service@afire-gene.com